Resources
Investigative Resources
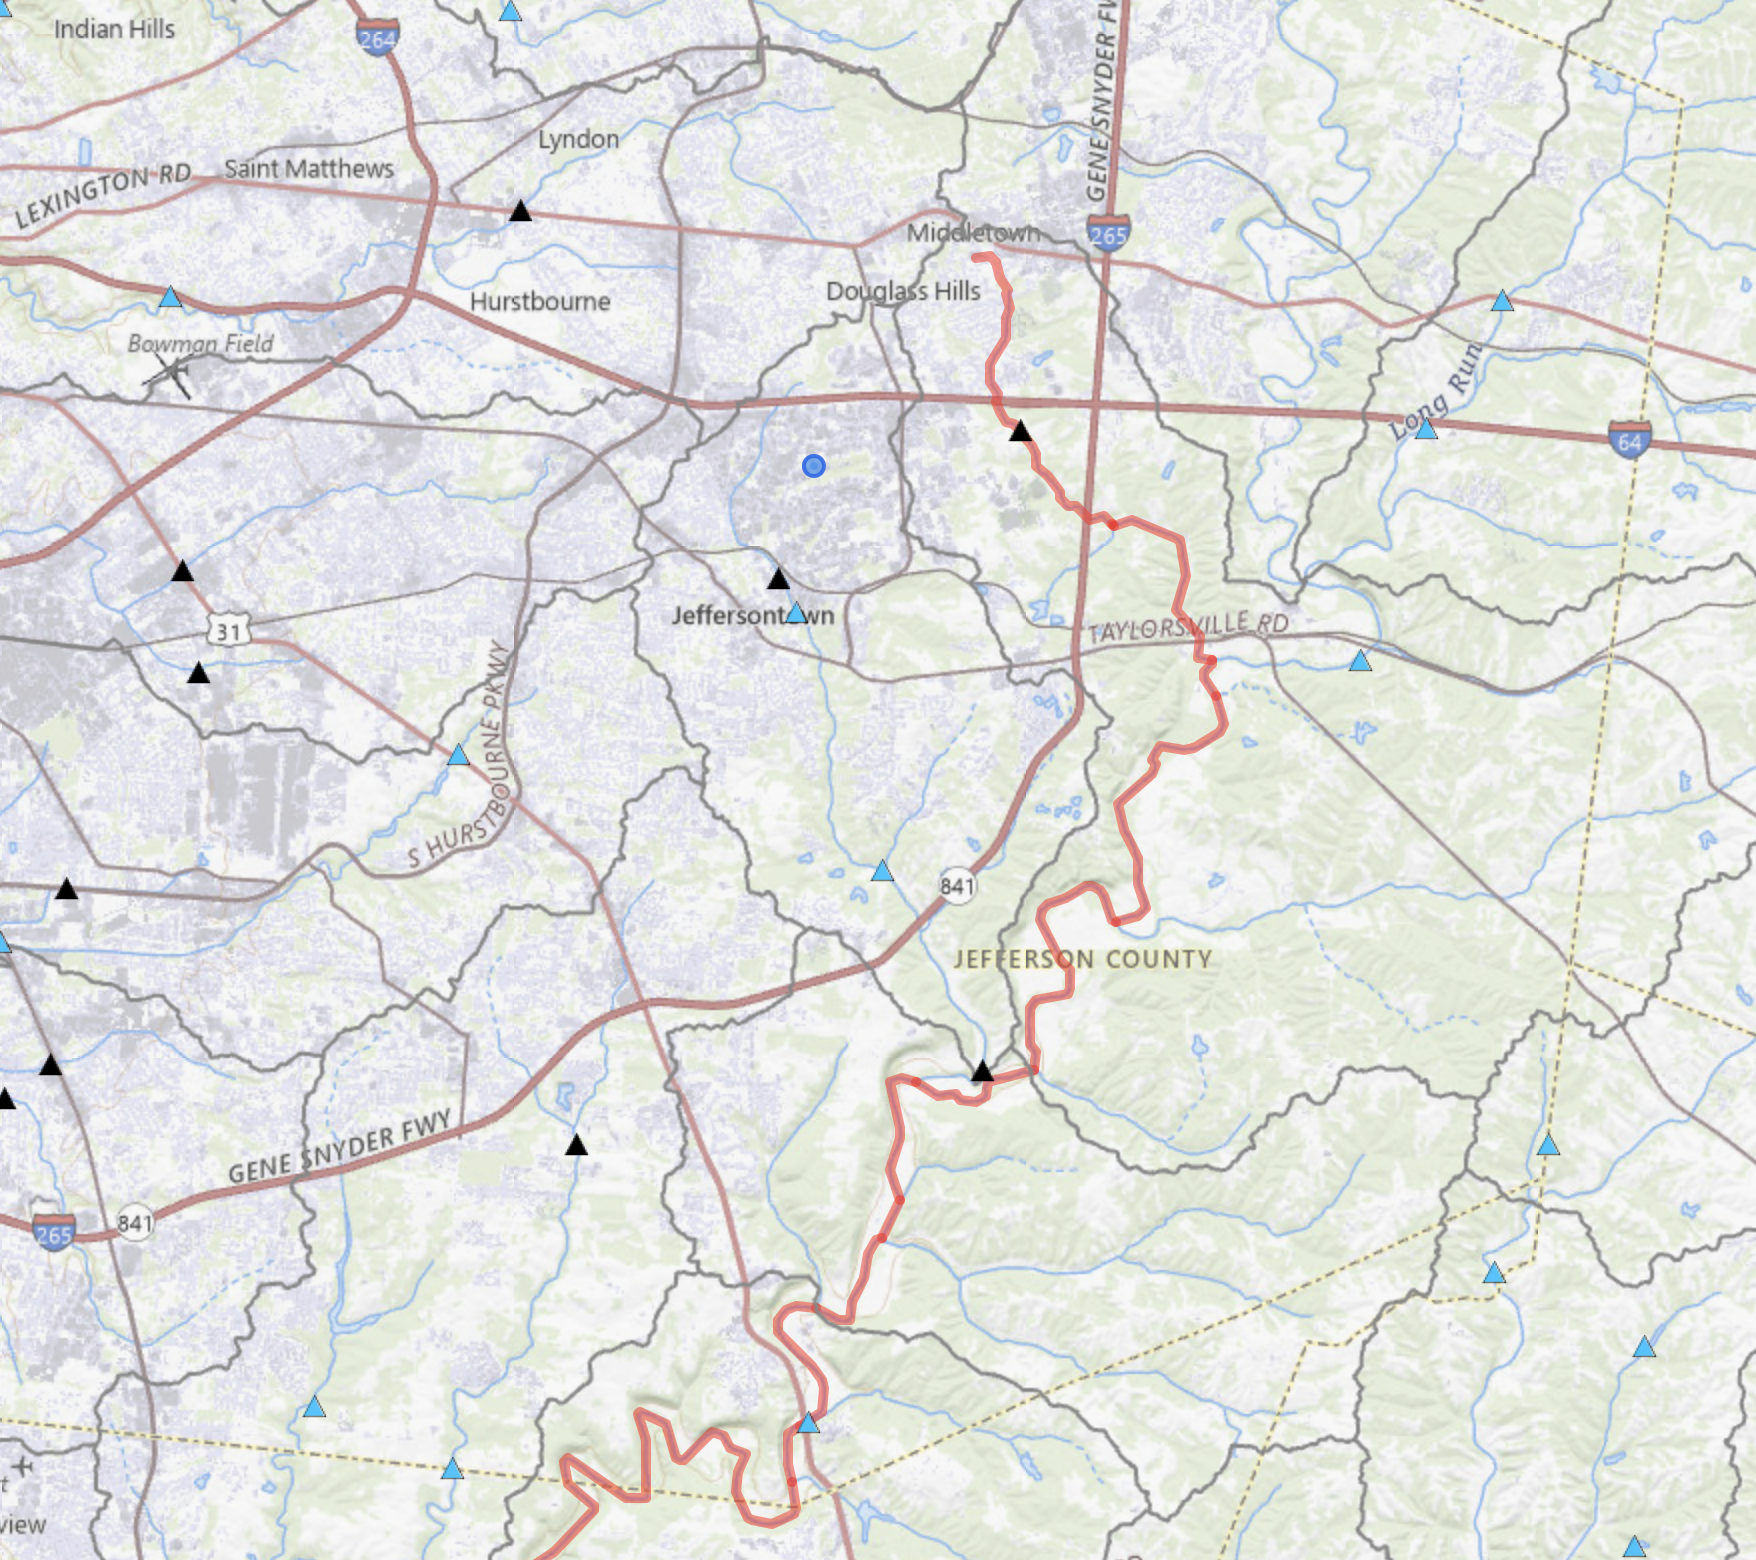
USGS - rain drop flow
Ever wonder the path of a rain drop?
StreamStats
1. Click the StreamStats link
2. Click on "Exploration Tools"
3. Click "Show your location"
4. Click "Flow (Raindrop) Path"
5. Click "Select a point on map" from the pop-up window
6. Click on the map
7. Click "Go" on pop-up window
USGS
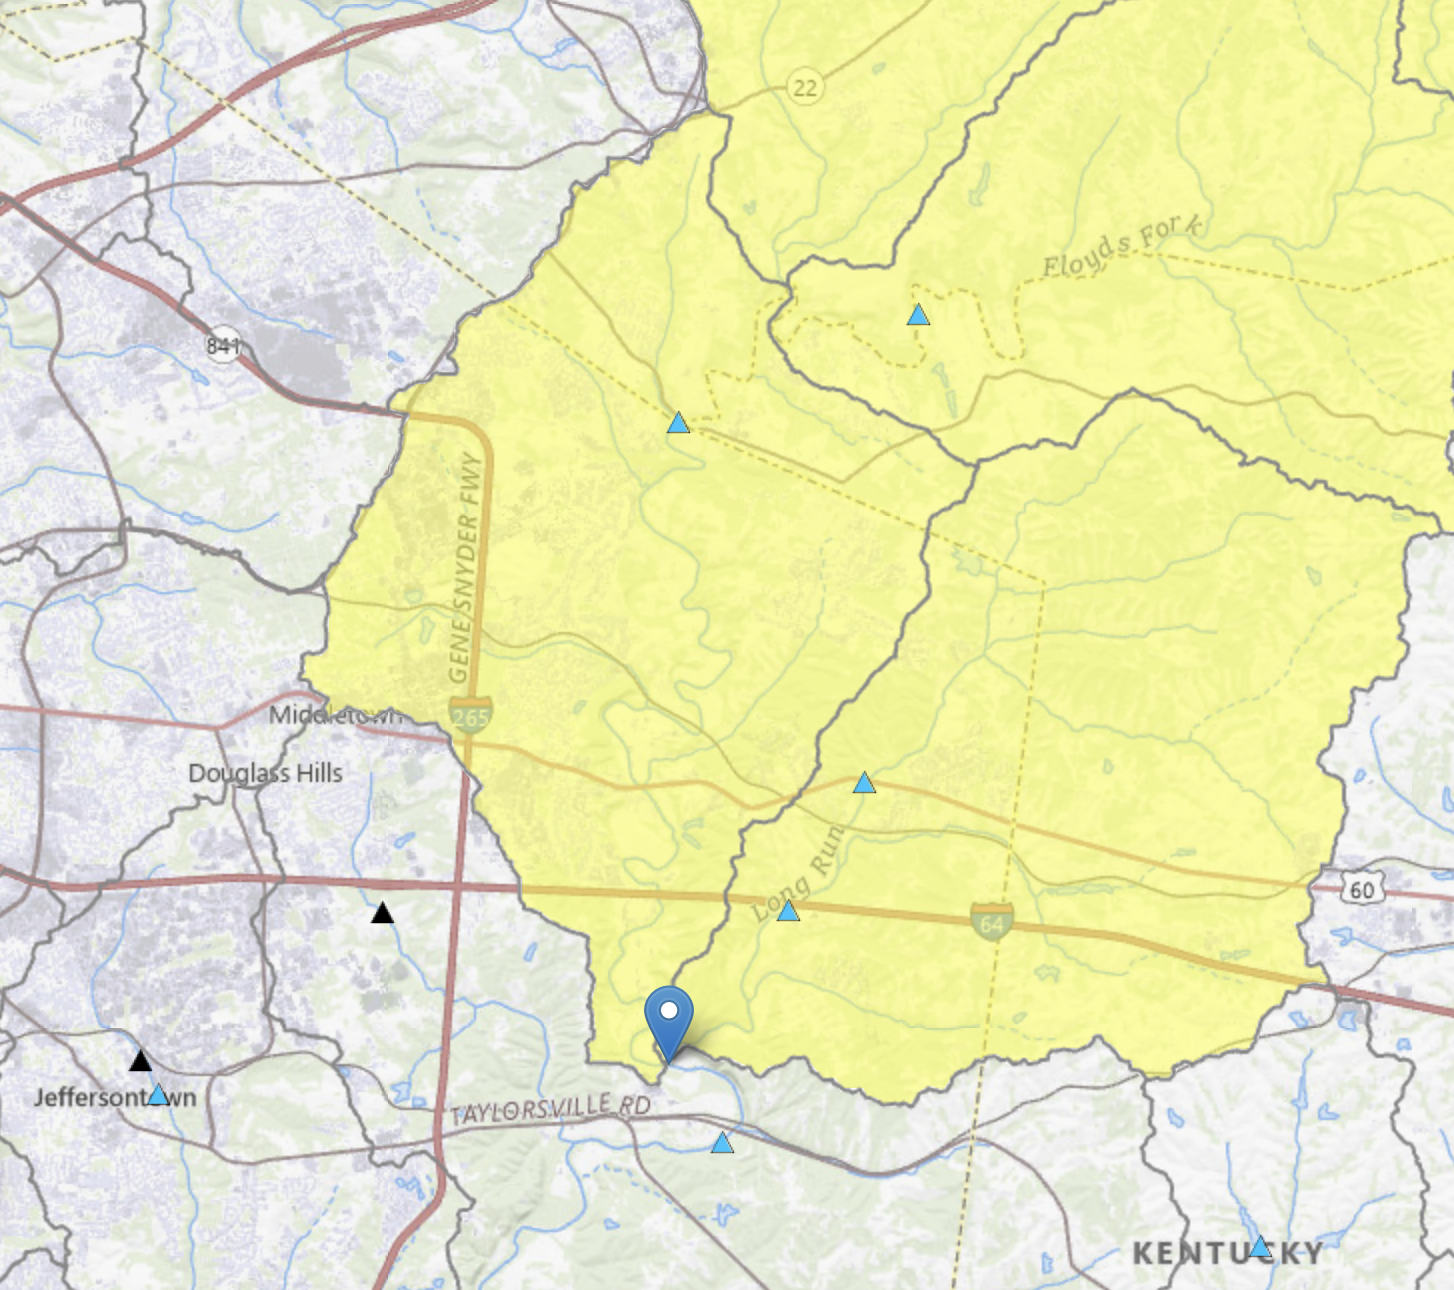
Where is all this water coming from?
Discover all the upstream locations that flow to a specific location
1. Click the StreamStats link
2. Type "FLOYDS FORK" in the search
3. Select the first one "FLOYDS FORK Division"
4. Select Kentucky
5. On the right, under "Layers" click "KY Map Layers"
6. Deselect "ExcludePolys"
7. Zoom in to level 15 (notice level in bottom left of screen)
8. Click a location on the map and hit "Delineate" to discover the water source for that location
USGS
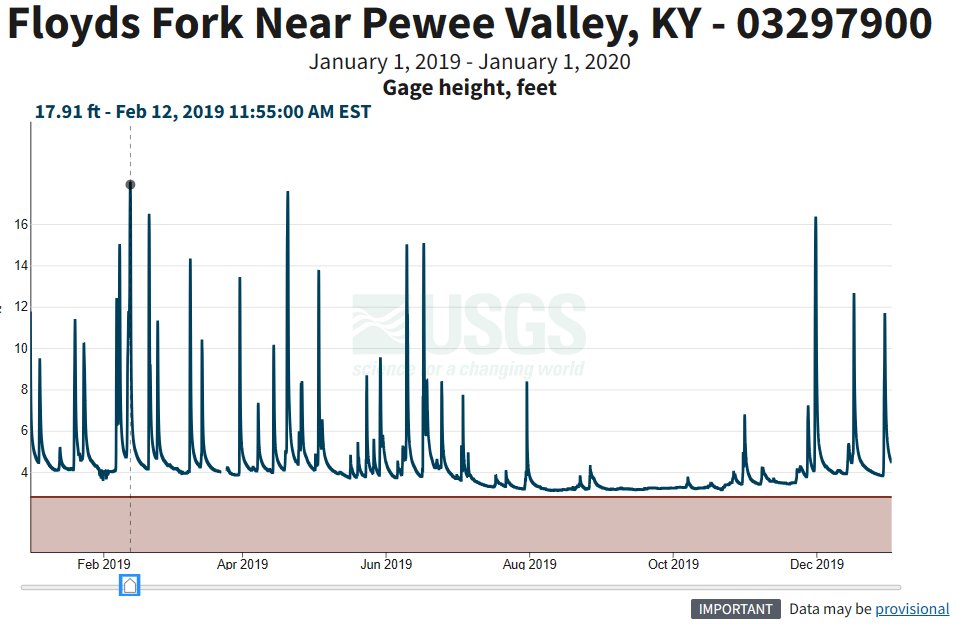
There are four USGS gauges along FLOYDS FORK that provide excellent information. Discover the height, speed, clarity, temperature, PH levels and many other data points.
Go directly to a Floyds Fork USGS gauge:
1. Ash Ave/Peewee Valley
2. Fisherville
3. Mt. Washington (The Parklands entrance at Bardstown Rd)
4. Shepherdsville (just before the Salt River input)
MSD
We have met with many MSD employees, from the MSD Exec. Dir. to engineers and "line workers." We have attended board meetings and spent time "in the field" with them. The individuals with whom we have met are honest and truly care about water quality.
Throughout the community there are many competing voices and interests and MSD is often viewed as the regulator and enforcer. While Louisville Keep Your Fork often advocates for increased protections, our primary focus is to ensure each plan in the Floyds Fork watershed is heavily scrutinized by MSD. Additionally, we want to ensure each plan is being properly fulfilled throughout construction.
Many developers state, "MSD will make sure we follow the design manual." The Design Manual is linked here. As a community, we are all heavily impacted by this manual and it would be wise to look through it and provide concerns, questions, and feedback.
Of all the agencies with whom we have worked, MSD has been the most receptive to and even invites honest feedback regarding their impact. They currently have a 2025 Survey for their customers and partners (if still active - check it out here).

Read the MSD Design Manual
This MSD Design Manual is a guide for the planning and design of stormwater systems, flood protection works, sanitary sewers, erosion control structures, small sanitary pump stations, small wastewater treatment plants and associated activities for the Louisville and Jefferson County Metropolitan Sewer District.
Additional Links
Link: MSD Rain Gauge
Link: Discharge Monitoring Report (DMR)
Monthly reports for each of the MSD waste water treatment plants
Link: MSD Project WIN Consent Decree
Link: MSD Water quality homepage
Link: MSD Monitoring Discusses MSD efforts and they are reported
Link: MSD - What is a healthy watershed?
LOJIC
Louisville and Jefferson County Information Consortium
Maps (and so much more) for Louisville.
LOJIC Online (most common maps)
Additional LOJIC maps (even more under each tab)
Division of Water (DOW)
The DOW is under the KY Energy and Environment Cabinet (KY EEC).
Our encounters with DOW inspectors has been decent, but our communications with the permit office has been less than encouraging with one employee telling us there shouldn't be basins at all. In their opinion, as they told us, it would be better if all the water went directly to Floyds Fork, even the trash, chemicals, and everything else. In our opinion, this is an example of local control is better. MSD definitely shows more care and concern than the KY EEC. DOW shows wonderful pictures of environmental protections, but their dismissal of even sewage in Floyds Fork is incredibly disturbing.
This Quick Guide will help you understand more about why and how communities in the Commonwealth of Kentucky manage floodplains and regulate floodplain development to protect people and property.
Additional Links
Link: Water Map Portal
Link: Harmful Algal Bloom (HAF) map/viewer
Link: Harmful Algal Bloom information
Email: Report a Harmful Bloom
If you have any questions or would like to report a bloom, please use the bloomWatch app, contact water@ky.gov or call 502-564-3410. To report a bloom after hours and on weekends, you may contact the 24-hour hotline at 502-564-2380 or 1-800-928-2380.
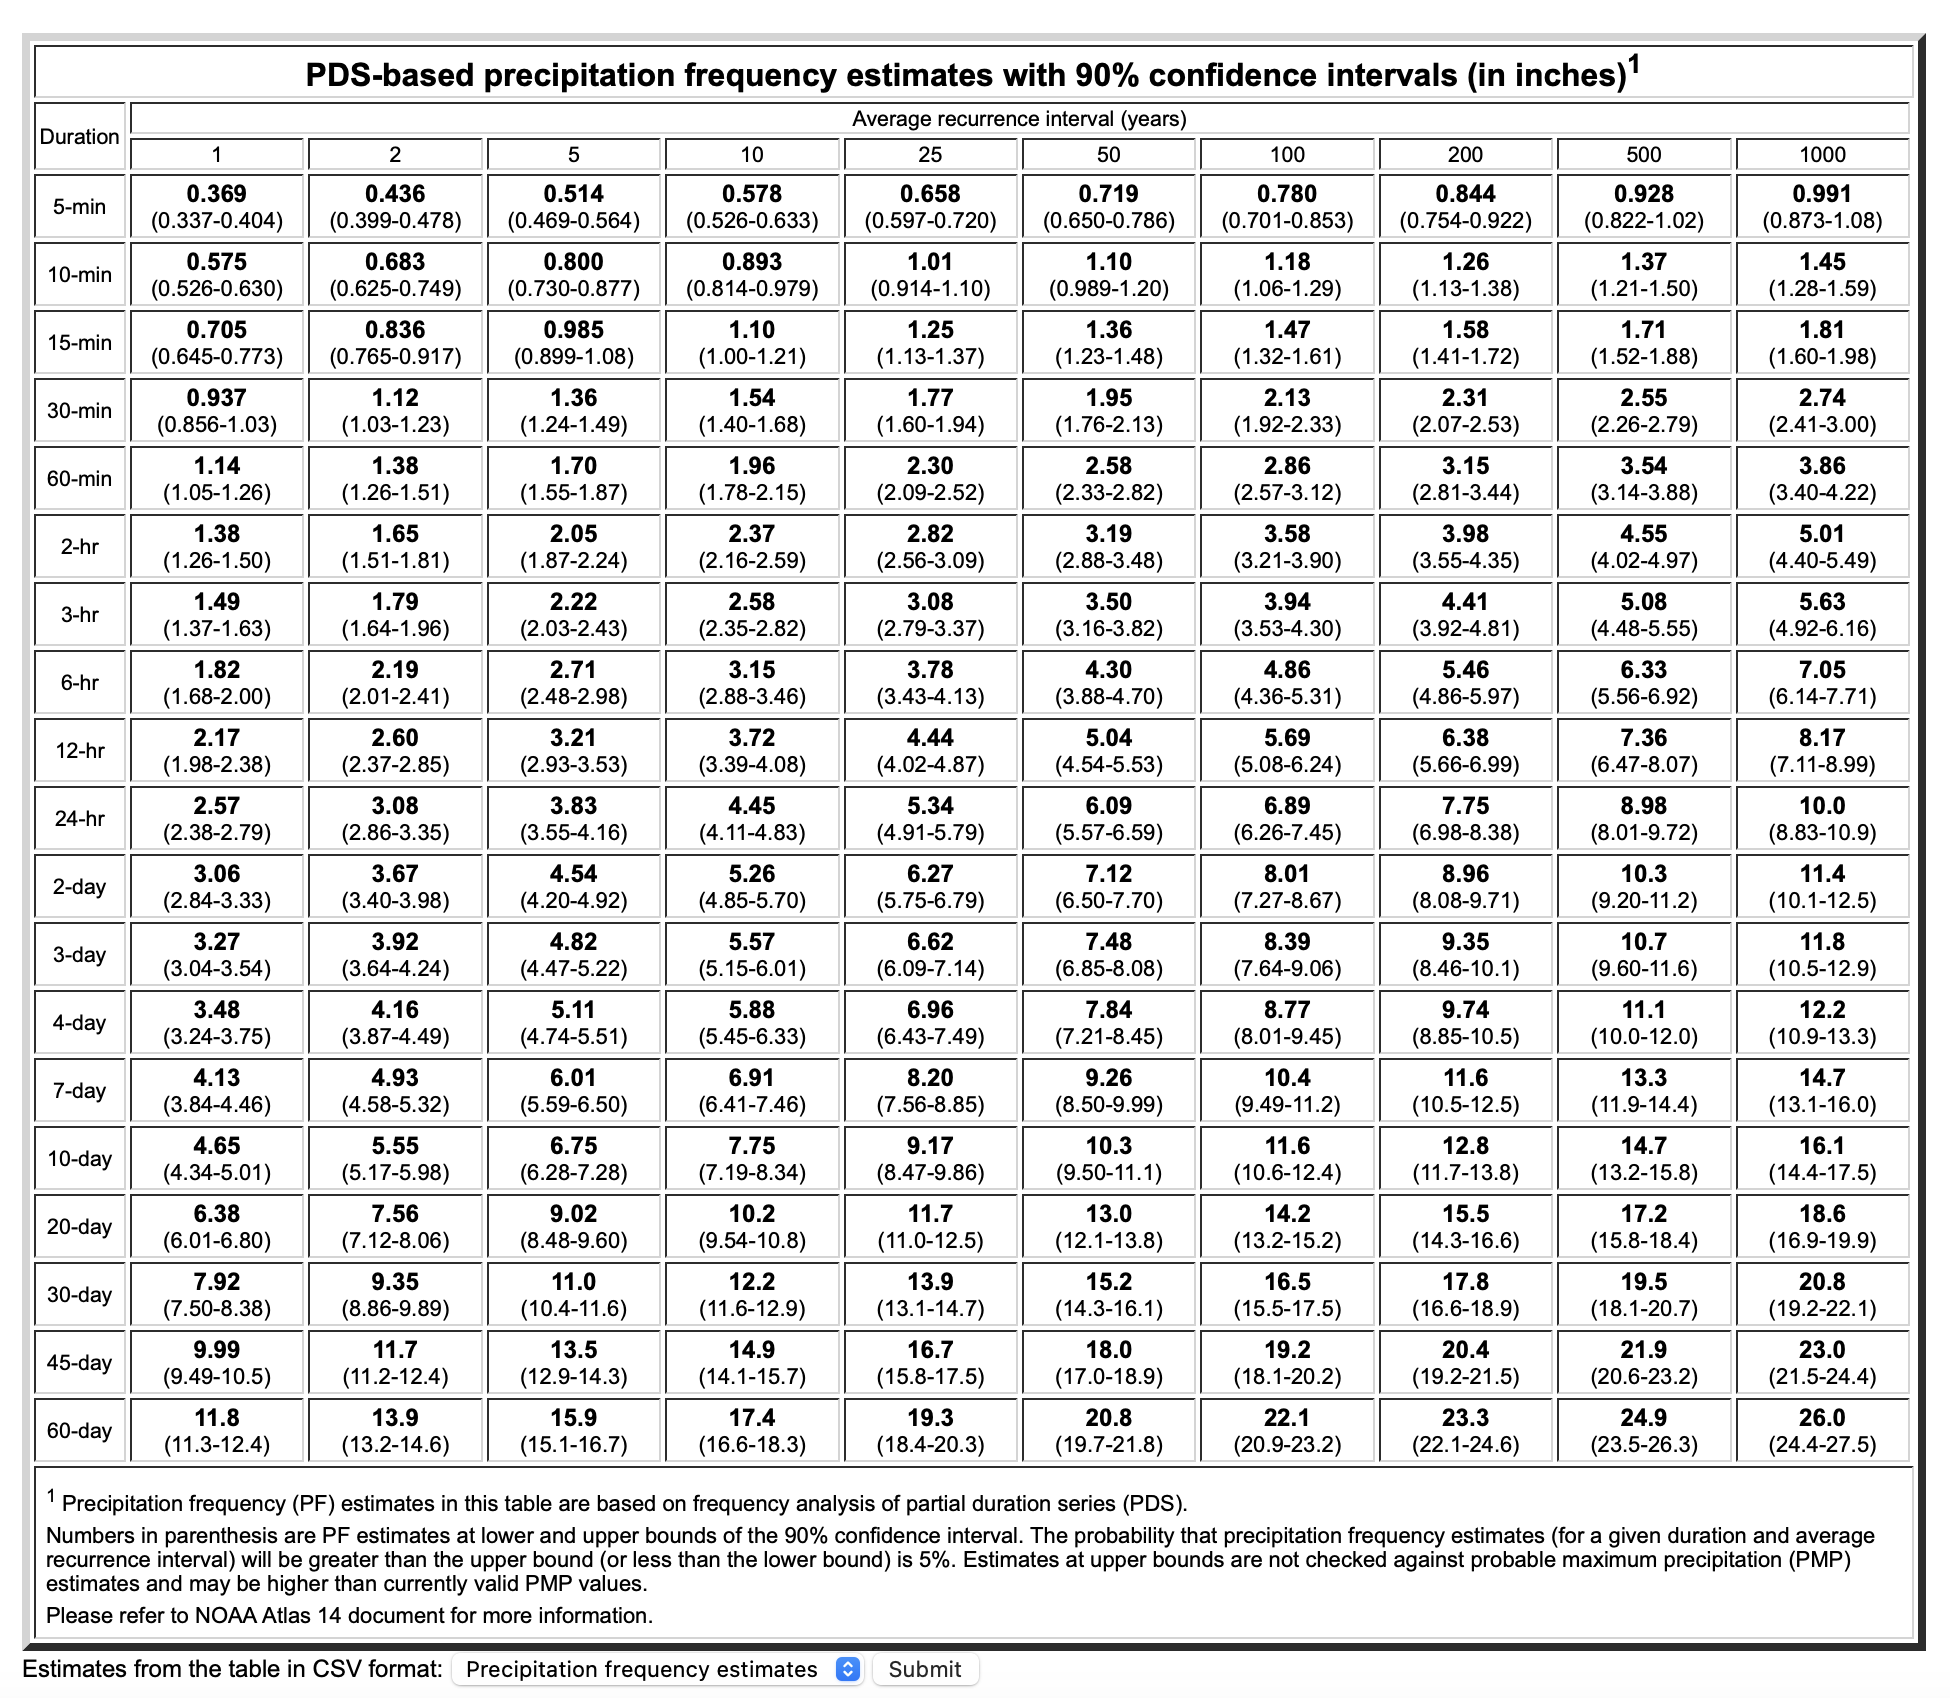
NOAA National Weather Service
How much rain equals a 100-year flood in your area? 50-yr? 10-yr?
Click the NOAA link and type your address to find out.
Additional NOAA Resources:
Build a Watershed activity
Watershed and Rainscaping lesson
Watershed, Flooding, & Pollution
NSSL Research: Flooding
and MANY MORE!
COCORAHS
Join the thousands of people tracking rain events around the country. Get a 4" rain gage that can hold up to 13" and update your information daily (or as often as you are able).
FYI: COCORAHS is an acronym for Community Collaborative Rain, Hail and Snow Network
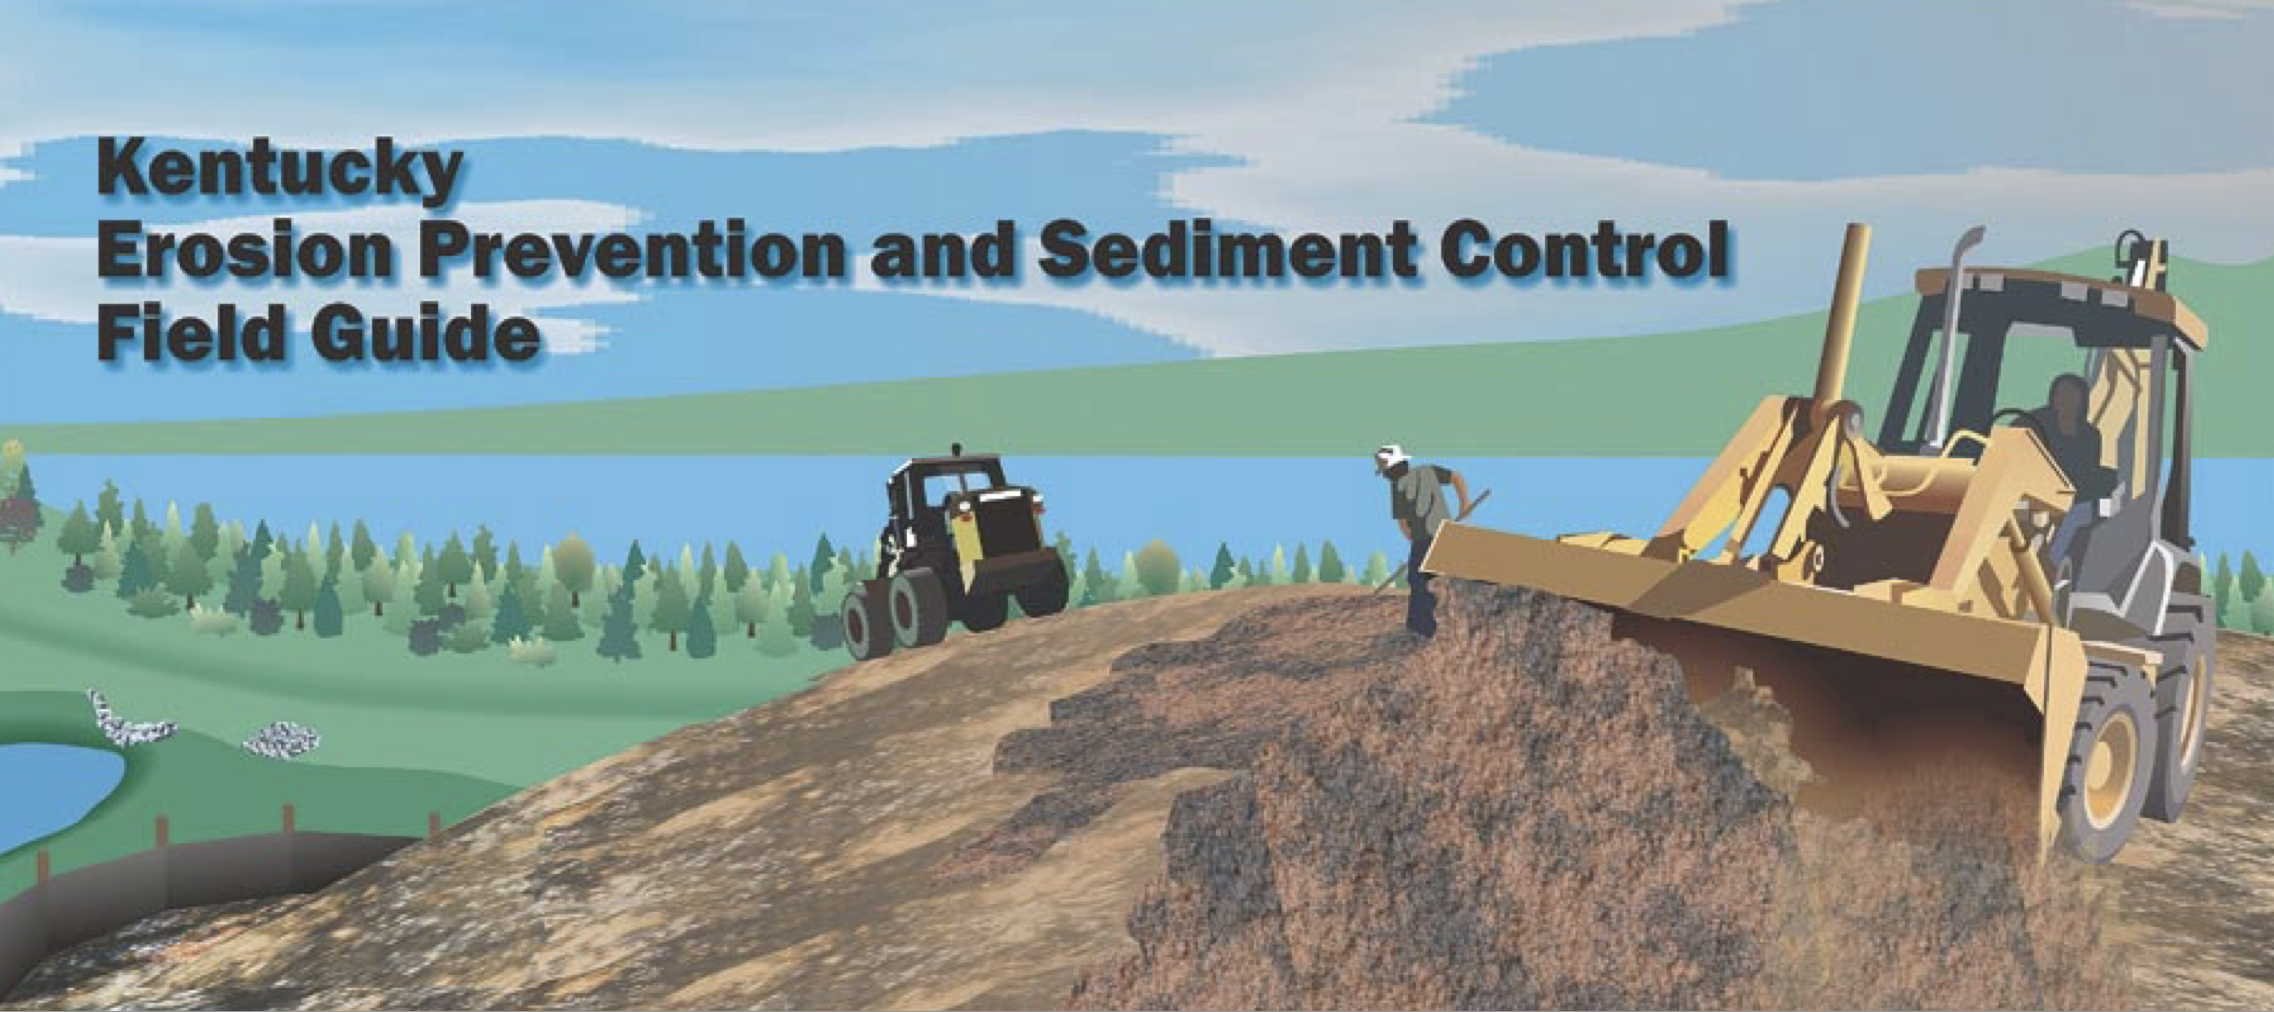
EPA - Sediment Control
Kentucky Erosion Prevention and Sediment Control Field Guide
This Field Guide will take you through the erosion and sediment control process. The guide starts out with sections on pre-project planning and operational activities. The rest of the guide discusses erosion prevention and sediment control by starting at the top of the hill, above the project site, and proceeding down the slope through the bare soil area, ditches and channels, traps and basins, and on down to the waterways below.
KYTC - Environmental Overview

USGS - rain drop flow
Ever wonder the path of a rain drop?
StreamStats
1. Click the StreamStats link
2. Click on "Exploration Tools"
3. Click "Show your location"
4. Click "Flow (Raindrop) Path"
5. Click "Select a point on map" from the pop-up window
6. Click on the map
7. Click "Go" on pop-up window
USGS
What is feeding this waterway?USGS has many extremely powerful data tools. StreamStats is a great place to start.
StreamStats: Discover all the upstream locations that flow to a specific location
1. Click the StreamStats link
2. Type "FLOYDS FORK" in the search
3. Select the first one "FLOYDS FORK Division"
4. Select Kentucky
5. On the right, under "Layers" click "KY Map Layers"
6. Deselect "ExcludePolys"
7. Zoom in to level 15 (notice level in bottom left of screen)
8. Click a location on the map and hit "Delineate" to discover the water source for that location
USGS
There are four USGS gauges along FLOYDS FORK that provide excellent information. Discover the height, speed, clarity, temperature, PH levels and many other data points.
Go directly to a Floyds Fork USGS gauge:
1. Ash Ave/Peewee Valley
2. Fisherville
3. Mt. Washington (The Parklands entrance at Bardstown Rd)
4. Shepherdsville (just before the Salt River input)
MSD
We have met with many MSD employees, from the MSD Exec. Dir. to engineers and "line workers." We have attended board meetings and spent time "in the field" with them. The individuals with whom we have met are honest and truly care about water quality.
Throughout the community there are many competing voices and interests and MSD is often viewed as the regulator and enforcer. While Louisville Keep Your Fork often advocates for increased protections, our primary focus is to ensure each plan in the Floyds Fork watershed is heavily scrutinized by MSD. Additionally, we want to ensure each plan is being properly fulfilled throughout construction.
Many developers state, "MSD will make sure we follow the design manual." The Design Manual is linked here. As a community, we are all heavily impacted by this manual and it would be wise to look through it and provide concerns, questions, and feedback.
Of all the agencies with whom we have worked, MSD has been the most receptive to and even invites honest feedback regarding their impact. They currently have a 2025 Survey for their customers and partners (if still active - check it out here).
Additional Links:
Link: MSD Rain Gauge
Link: Discharge Monitoring Report (DMR)
Monthly reports for each of the MSD waste water treatment plants
Link: MSD Project WIN Consent Decree
Link: MSD Water quality homepage
Link: MSD Monitoring Discusses MSD efforts and they are reported
Link: MSD - What is a healthy watershed?
Read the MSD Design Manual
This MSD Design Manual is a guide for the planning and design of stormwater systems, flood protection works, sanitary sewers, erosion control structures, small sanitary pump stations, small wastewater treatment plants and associated activities for the Louisville and Jefferson County Metropolitan Sewer District.
LOJIC
Louisville and Jefferson County Information Consortium
Maps (and so much more) for Louisville.
LOJIC Online (most common maps)
Additional LOJIC maps (even more under each tab)
Division of Water (DOW)
This Quick Guide will help you understand more about why and how communities in the Commonwealth of Kentucky manage floodplains and regulate floodplain development to protect people and property.
NOAA National Weather Service
How much rain equals a 100-year flood in your area? 50-yr? 10-yr?
Click the NOAA link and type your address to find out.
Additional NOAA Resources:
Build a Watershed activity
Watershed and Rainscaping lesson
Watershed, Flooding, & Pollution
NSSL Research: Flooding
and MANY MORE!
COCORAHS
Join the thousands of people tracking rain events around the country. Get a 4" rain gage that can hold up to 13" and update your information daily (or as often as you are able).
FYI: COCORAHS is an acronym for Community Collaborative Rain, Hail and Snow Network
EPA - Sediment Control
Kentucky Erosion Prevention and Sediment Control Field Guide
This Field Guide will take you through the erosion and sediment control process. The guide starts out with sections on pre-project planning and operational activities. The rest of the guide discusses erosion prevention and sediment control by starting at the top of the hill, above the project site, and proceeding down the slope through the bare soil area, ditches and channels, traps and basins, and on down to the waterways below.
KYTC - Environmental Overview